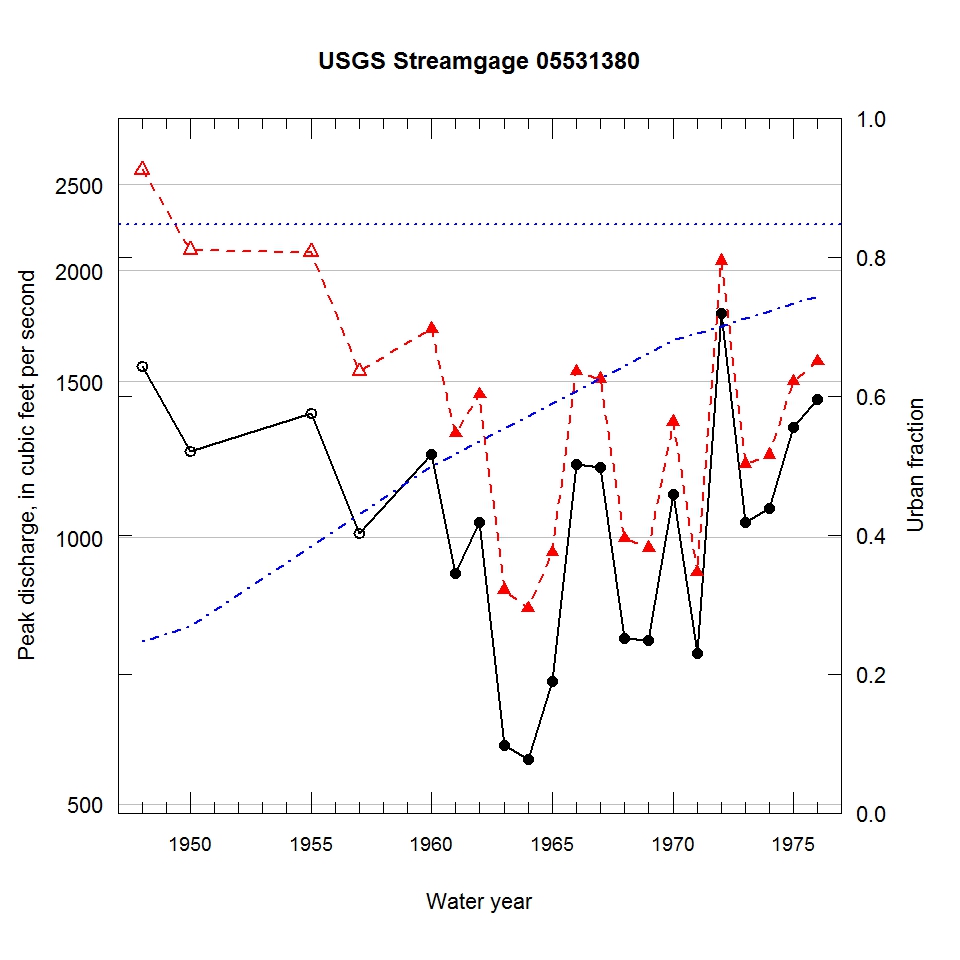
Observed and urbanization-adjusted annual maximum peak discharge and associated urban fraction and precipitation values at USGS streamgage:
05531380 SALT CREEK AT OAK BROOK, IL


| Water year | Segment | Discharge code | Cumulative reservoir storage (acre-feet) | Urban fraction | Precipitation (inches) | Observed peak discharge (ft3/s) | Adjusted peak discharge (ft3/s) | Exceedance probability |
| 1948 | 1 | 7 | 409 | 0.247 | 1.910 | 1560 | 2600 | 0.051 |
| 1950 | 1 | 7 | 409 | 0.269 | 1.232 | 1250 | 2110 | 0.109 |
| 1955 | 1 | 7 | 409 | 0.384 | 3.452 | 1380 | 2100 | 0.112 |
| 1957 | 1 | 7 | 409 | 0.430 | 2.741 | 1010 | 1540 | 0.304 |
| 1960 | 1 | -- | 409 | 0.499 | 0.375 | 1240 | 1720 | 0.209 |
| 1961 | 1 | -- | 409 | 0.517 | 1.498 | 911 | 1310 | 0.466 |
| 1962 | 1 | -- | 409 | 0.535 | 0.251 | 1040 | 1450 | 0.369 |
| 1963 | 1 | -- | 409 | 0.553 | 1.263 | 582 | 872 | 0.813 |
| 1964 | 1 | -- | 409 | 0.571 | 0.747 | 562 | 832 | 0.840 |
| 1965 | 1 | -- | 409 | 0.589 | 0.160 | 689 | 962 | 0.749 |
| 1966 | 1 | -- | 409 | 0.607 | 1.295 | 1210 | 1540 | 0.299 |
| 1967 | 1 | -- | 409 | 0.625 | 1.414 | 1200 | 1510 | 0.324 |
| 1968 | 1 | -- | 509 | 0.643 | 1.651 | 770 | 997 | 0.722 |
| 1969 | 1 | -- | 509 | 0.661 | 1.433 | 766 | 973 | 0.741 |
| 1970 | 1 | -- | 509 | 0.679 | 1.465 | 1120 | 1350 | 0.443 |
| 1971 | 1 | -- | 509 | 0.690 | 0.360 | 740 | 913 | 0.784 |
| 1972 | 1 | -- | 509 | 0.701 | 1.286 | 1790 | 2050 | 0.125 |
| 1973 | 1 | -- | 509 | 0.711 | 1.248 | 1040 | 1210 | 0.541 |
| 1974 | 1 | -- | 509 | 0.722 | 1.047 | 1080 | 1240 | 0.519 |
| 1975 | 1 | -- | 509 | 0.733 | 0.977 | 1330 | 1500 | 0.330 |
| 1976 | 1 | -- | 509 | 0.743 | 1.064 | 1430 | 1580 | 0.273 |

